Table of Contents
Setting up the reception and display of data from the weather station
Note: the description is valid for versions 1.7.73 and higher.
The SL NEO platform allows you to visualize data received from a weather station. The toolkit for working with the station complements the technology of reading data from external sources: the information from the station goes to the RSS server of the SL NEO platform, then the RSS data is transferred to the graphic compositions, parameterizing the text and animation layers.
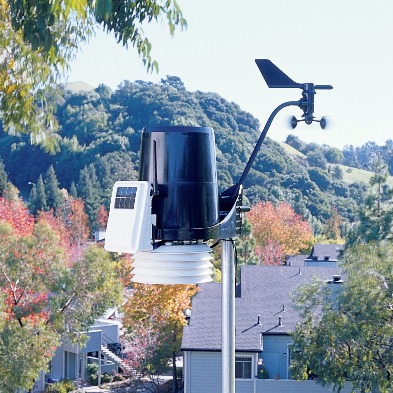
The SL NEO platform supports weather stations produced by Davis Instruments (USA), the most universal and popular model is Davis Cabled Vantage Pro2 with USB interface (we do not recommend stations with Wi-Fi interface due to possible problems with communication channel).
Basic measurement parameters:
- current atmospheric pressure,
- air temperature,
- air humidity,
- wind speed,
- wind direction,
- data for short-term weather forecast.
Connecting the station, setting the server software SL NEO
When purchasing the station, please note that the USB module is optional and is not included in the basic delivery set of the station. No additional software is required for the integration of the station with the SL NEO platform, only the USB-COM interface driver is required for installation, its full name is Silicon Labs CP210x USB to UART Bridge VCP Driver (Windows version).
You can connect the station directly to the SL NEO server, but it is preferable to use a separate machine with the SL NEO server software, in which only the interaction module with the station is active. In this scheme several SL NEO servers can receive RSS weather information simultaneously.
Procedure of setting up the station and the SL NEO server module that receives data and generates RSS feeds
STEP 1: Connect and configure the station according to the instructions supplied with it. After turning on, it is necessary to press and hold the DONE button on the system unit for the readings to appear. The baud rate of the station is 19200 by default. The same baud rate should be set for the COM port of the machine to which the station is connected, the port number can be found in the Windows Device Manager.
STEP 2. Add the module for receiving data from the station into the system. Stop the server components using the “Stop Server” command from the taskbar, then select the “Configure Server Components” option. In the settings window, in the Available components field, from the Data Providers/Meteo Stations/Davis Instruments Corp. section, add the Vantage Pro element to the right field, which will receive data and form the RSS-feed. Launch server software - Start Server.
STEP 3. Configure the Vantage Pro item. The settings will be made from the web-console - Administrator Control Panel. The management console is accessed either locally from the server or from any computer on the network at http://server_ip:7901. You must log in as an administrator.
After logging into the console, select Manage in the console menu, then select the Data Providers tab, select Service Enabled in the Davis Instruments Corp./Vantage Pro window. Then set up the connection - in Connection Paramerers field indicate the number of corresponding virtual COM-port, to which the station is connected, in Name field indicate the resource name, for example - Meteo_Station or leave default value unchanged.
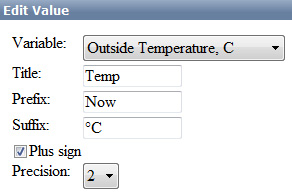
Then we set up the measurement parameters: in the Values field, select Add. In the opened Add Value window we select the measurement parameter in the Vairable field; in the Title field we specify the parameter name in any form; in the Prefix field we specify the text that will be displayed before the numeric value; in the Suffix field we specify the text that will be displayed after the numeric value.
The Plus sign item is responsible for displaying the “+” sign before the temperature value, the Precision value allows you to set the number of digits after the decimal point in the displayed value.
The figure shows the option of setting the parameter for displaying the temperature (outdoor temperature sensor of the station is selected), the value will be transmitted via RSS and displayed in the format: “Now +22.50°C”.
Then, in a similar way you need to select and configure all necessary digital measurement parameters.
Transmit information to parameterize the weather icons
In addition to numerical values, the station transmits short-term weather forecast information. The forecast is transmitted as a parameter, which can contain one of 10 values:
- Mostly Clear
- Partially Cloudy
- Mostly Cloudy
- Mostly Cloudy, Rain
- Mostly Cloudy, Snow
- Mostly Cloudy, Rain or Snow
- Partly Cloudy, Rain
- Partly Cloudy, Snow
- Partly Cloudy, Snow or Rain
- No Forecast Available.
The station also transmits information about wind direction. The short-term forecast and wind direction data can be used to parameterize PIP objects in the graphical compositions - static or animated icons.
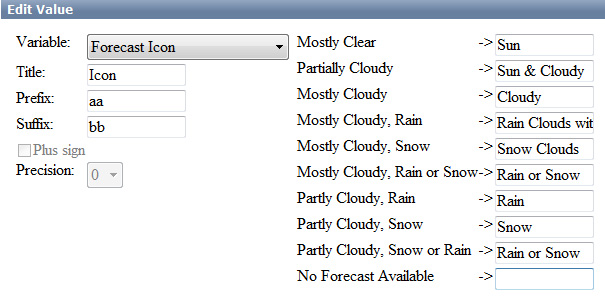
To configure short-term forecast data transfer we add a new parameter: select Add in the Values field. In the Add Value window that opens, select Forecast Icon in the Vairable field, and enter the parameter name in the Title field.
In the fields, representing types of weather conditions, we indicate the names of clips - static or animated icons, that are in the server's database and correspond to one or another weather condition.
If it is necessary to form several variants of compositions with different design, each of which uses different “sets” of icons, it is necessary to set several parameters passing values of Forecast Icon to RSS, with different sets of icon names. It is possible that in the Prefix, Suffix fields you specify the text that will be added to the clip names sent to RSS.
Similarly, the transmission of parameters (icon names) for displaying the wind direction is configured.
==== Check if RSS server ==== is working.
Checking is carried out with web-browser (it is desirable to use Mozilla Firefox). It is necessary to enter the address in the format http://server_ip:7901/rss, press Enter - then a list of active RSS resources should be displayed. Selecting the desired resource (in our example - Meteo_Station), make sure that it contains useful text information.
Settings in graphic composition to receive data from RSS module
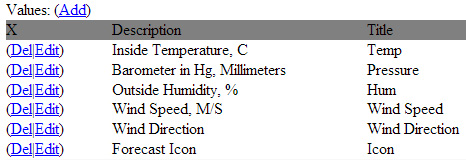
Let's look at an example where the Vantage Pro server module generates an RSS feed containing 6 parameters about the state of the weather. (see picture).
Let's define the duration of the composition, responsible for displaying the weather in 20 seconds - during this time, text objects with information about the temperature, pressure, humidity, wind direction (text with icon) should be displayed, replacing each other. The icon with the short-term forecast will be displayed during the whole duration of the composition.
In the Duration field we set 00:00:20:00. Set the Lead Out parameter to 00:00:00:00.
It is necessary to specify RSS data source for the composition, to do it in General tab in Data Feeds field specify the resource address in http://server_ip:7901/rss/RSS_name format, where RSS_name - service name specified during Vantage Pro module configuring (in our example - Meteo_Station).
Text objects
To display RSS text we will use objects of type Text Area. Parameters of each Text Area object are set in the Elements tab.
Let's set parameters of the first text object, that displays temperature information. In Sh (Show) field the value is 00:00:00:00 /In, in Hd (Hide) field the value is 00:00:05:00 /In - it means that the text will appear right after start (starting point In), it will disappear in 5 seconds after start. In the Scrolling field you can leave the default scrolling type - Still.
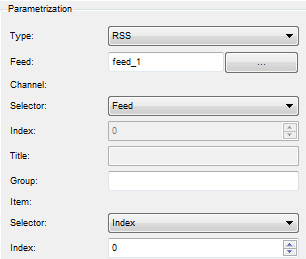
In the Parametrization field you must set the text parametrization: Type - type of text parametrization:
Disable - parametrization is disabled, the text typed in the Preview text window will be displayed, External - text parametrization mode from playlist lines, RSS - parametrization mode from RSS feed, this is what you need to set.
In the field Type: Feed: you need to select Feed_1 (in our example it forms the RSS with the weather information), as a data source, in the field Channel: Selector: set Feed, in the field Item: Selector: select Index with value 0. This means that for the temperature readings will be read the first value from the <item> - the temperature display module was first set in the SSS-module settings (see picture at the beginning of the section). Counting the positions starts from zero, respectively, to display the pressure you must select 1, humidity - 2, etc. according to the list.
Similarly the text objects displaying pressure, humidity and other parameters are set up. If necessary, you can set effects for objects using key points, or mix/wipe transitions.
PIP Objects
To create a new PIP (picture in picture) object, you can drag the selected clip with the weather icon from the Media Browser directly into the editing window. At that, new object will be created automatically, first Url field will be read from database and clip name will be written, In and Out values for the clip will also be read from database. Besides that, the original clip size will be saved.
Setting the parameterization of PIP objects is similar to the parameterization algorithm for text objects. The information containing the names of the icons (clips) to be displayed is transmitted to the RSS. Make sure that all icons, for which names are specified in the server RSS-module, are in the server's database. It is desirable that the icons responsible for displaying the same parameter have the same geometric dimensions. After you finish editing, you can view the clip in the File Monitor window and check the passage of RSS information.
An example of a composition displaying weather data can be downloaded from the link, a collection of static and animated symbols displaying weather information can be downloaded from the link. After downloading, the files should be imported into the server database.
It should be noted, that the SL NEO platform uses only a certain part of functions, implemented in the Davis Instruments weather stations. It is conditioned, first of all, by the specifics of most TV channels broadcasting: the basic parameters displayed are temperature, pressure and humidity, it is not customary to display detailed weather statistics and forecasts. If your TV channel needs to use the extended set of weather parameters, please contact us to discuss details.

